Dashboard tour
Find databases, connection guidance, operations, observability, configuration, and organization controls in the Parix console.
The Parix dashboard is the primary control-plane interface. It shows what exists, what state it is in, what the active plan permits, and which long-running changes are still converging.
Organization database list
The organization home page is the starting point for database work.
It provides:
- Refresh databases to reload current lifecycle state
- Card and List views when the organization has databases
- New database with New and Import actions
- one card or row per visible database
- database name, UUID, plan, status, update time, and region
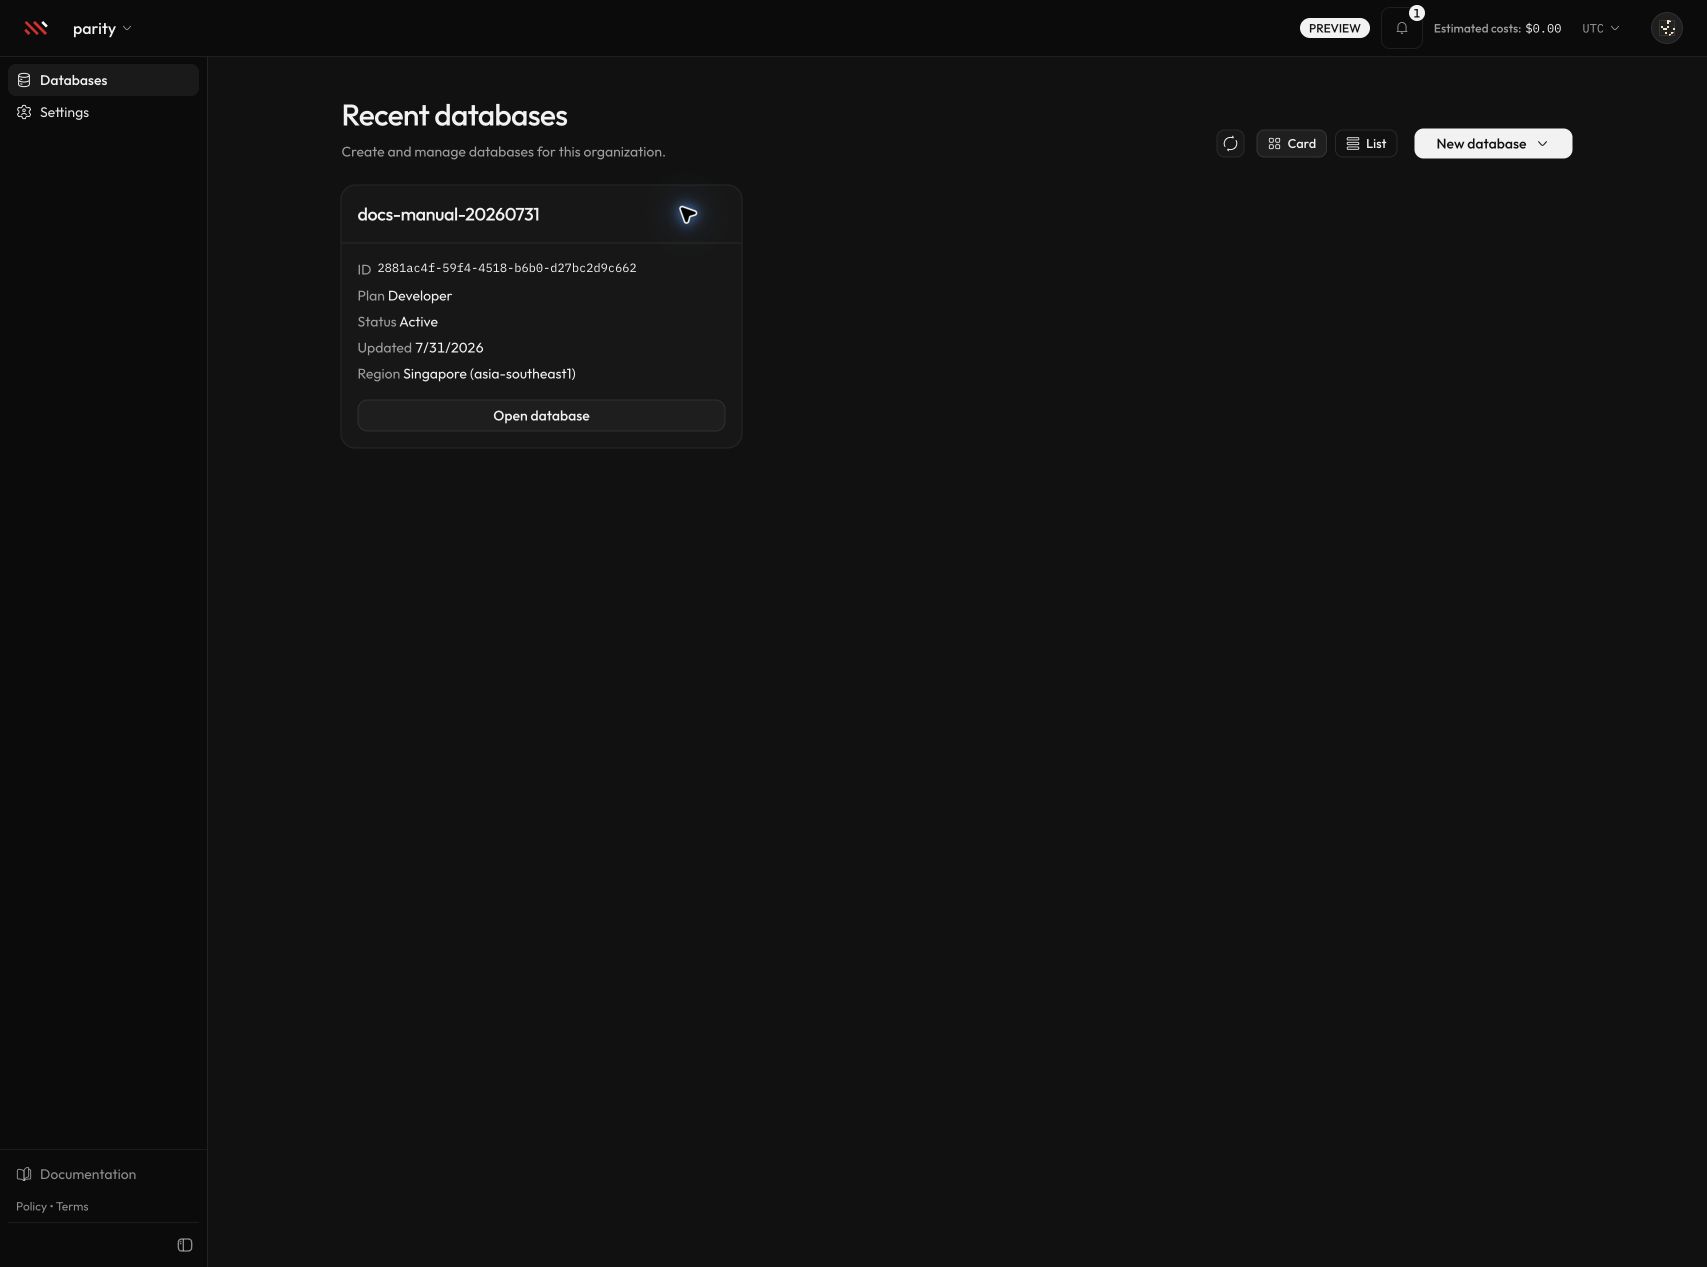
A populated organization shows each database's plan, lifecycle status, region, and entry action.
When the organization has no databases, the page keeps the creation action available and displays an explicit empty state.
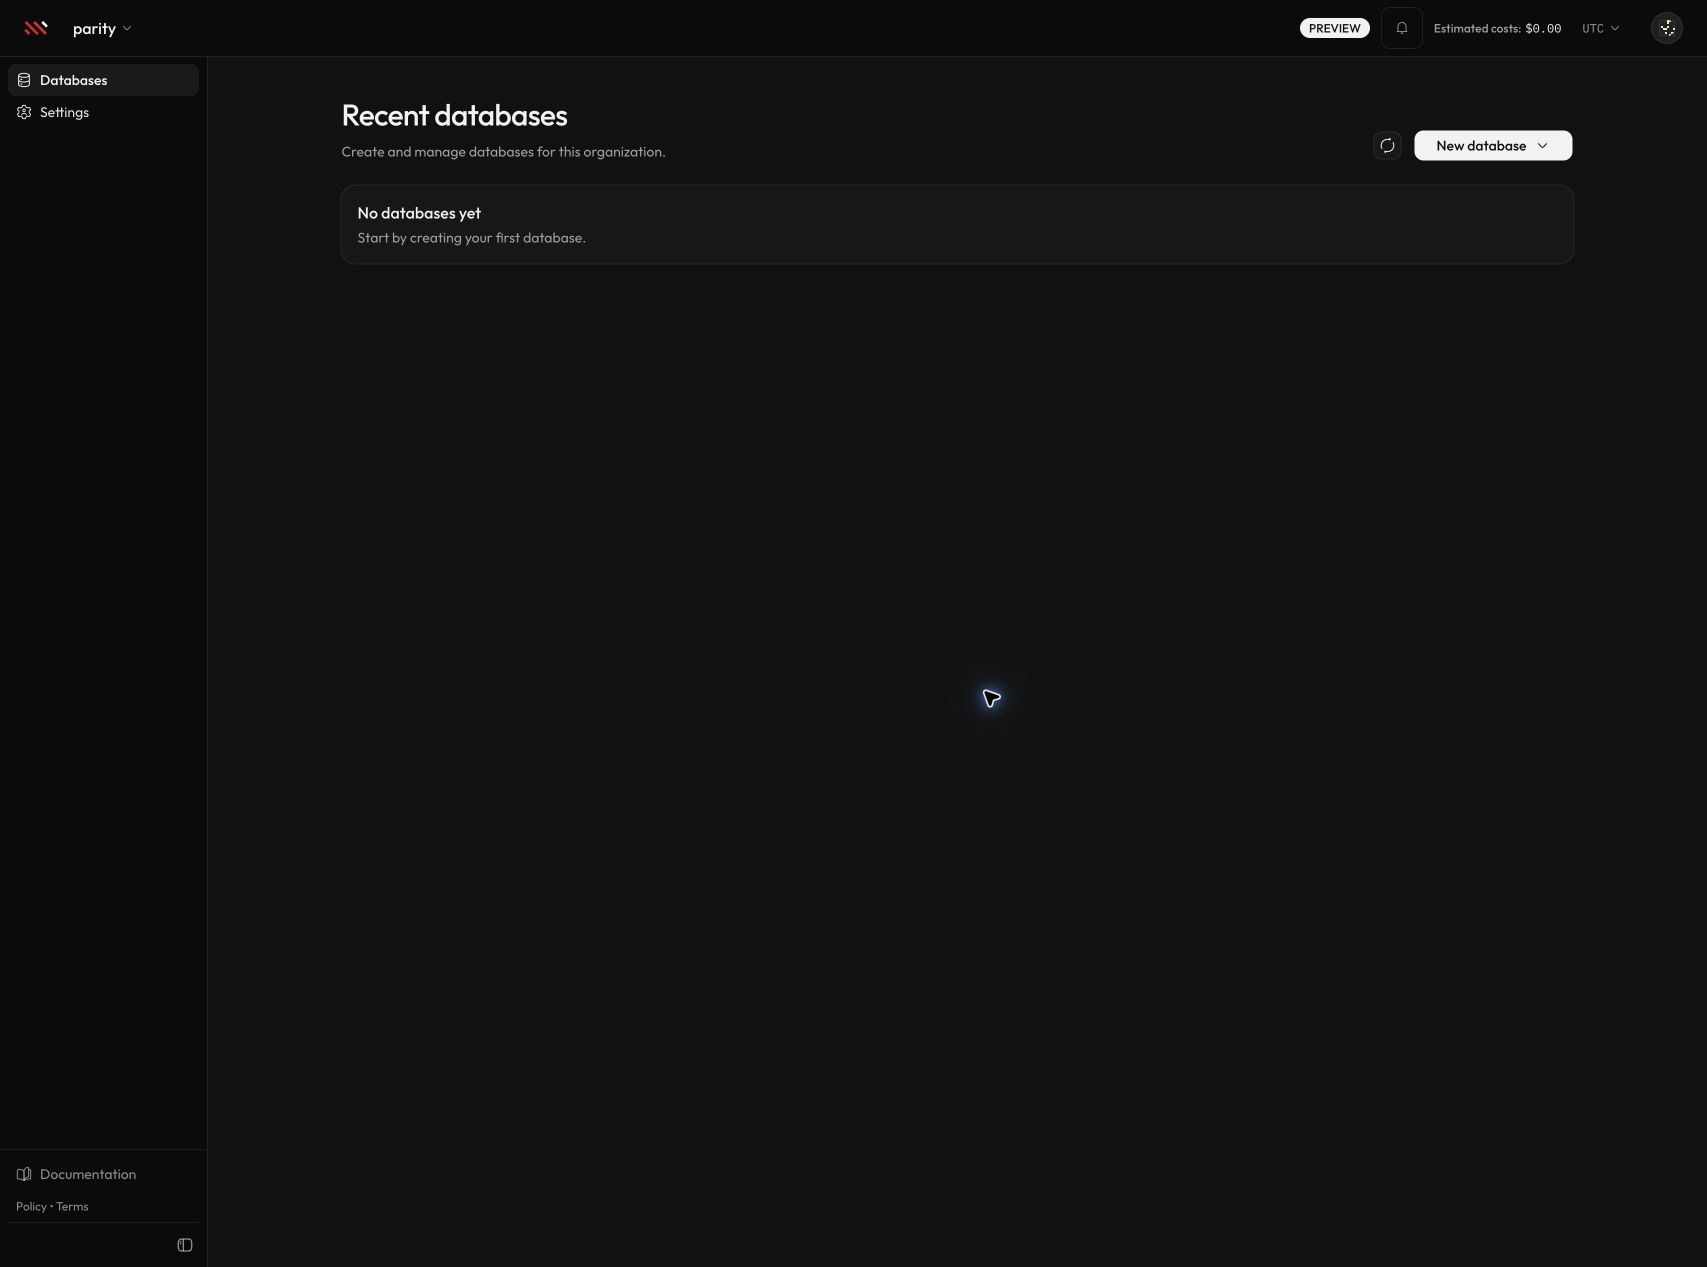
Database list results are capped at 100. If you operate near that limit, use a stable naming convention and the list view to keep lifecycle review manageable.
Global controls
The desktop header can expose:
- the active organization switcher
- the active database switcher on database routes
- technical-preview status
- notifications and unread count
- estimated organization cost linking to Billing
- display timezone
- the user menu
The user menu links to account settings, API keys, organizations, theme controls, and sign-out. Administrators can also receive admin-only navigation.
The left sidebar changes with context:
- organization pages show Databases and Settings, with Members, Billing, and Audit Log where the current membership permits them
- personal settings show Account, Organizations, API Keys, Notifications, Sessions, and Security log
- database pages show only the surfaces allowed by the database plan
Database dashboard
Open a database to see its lifecycle and connection context.
A ready dashboard includes:
- database name and Connect action
- user-visible lifecycle status
- topology visualization
- TigerBeetle version
- plan and billing posture
- database UUID
- provider and region or shared-cell placement
- estimated monthly price
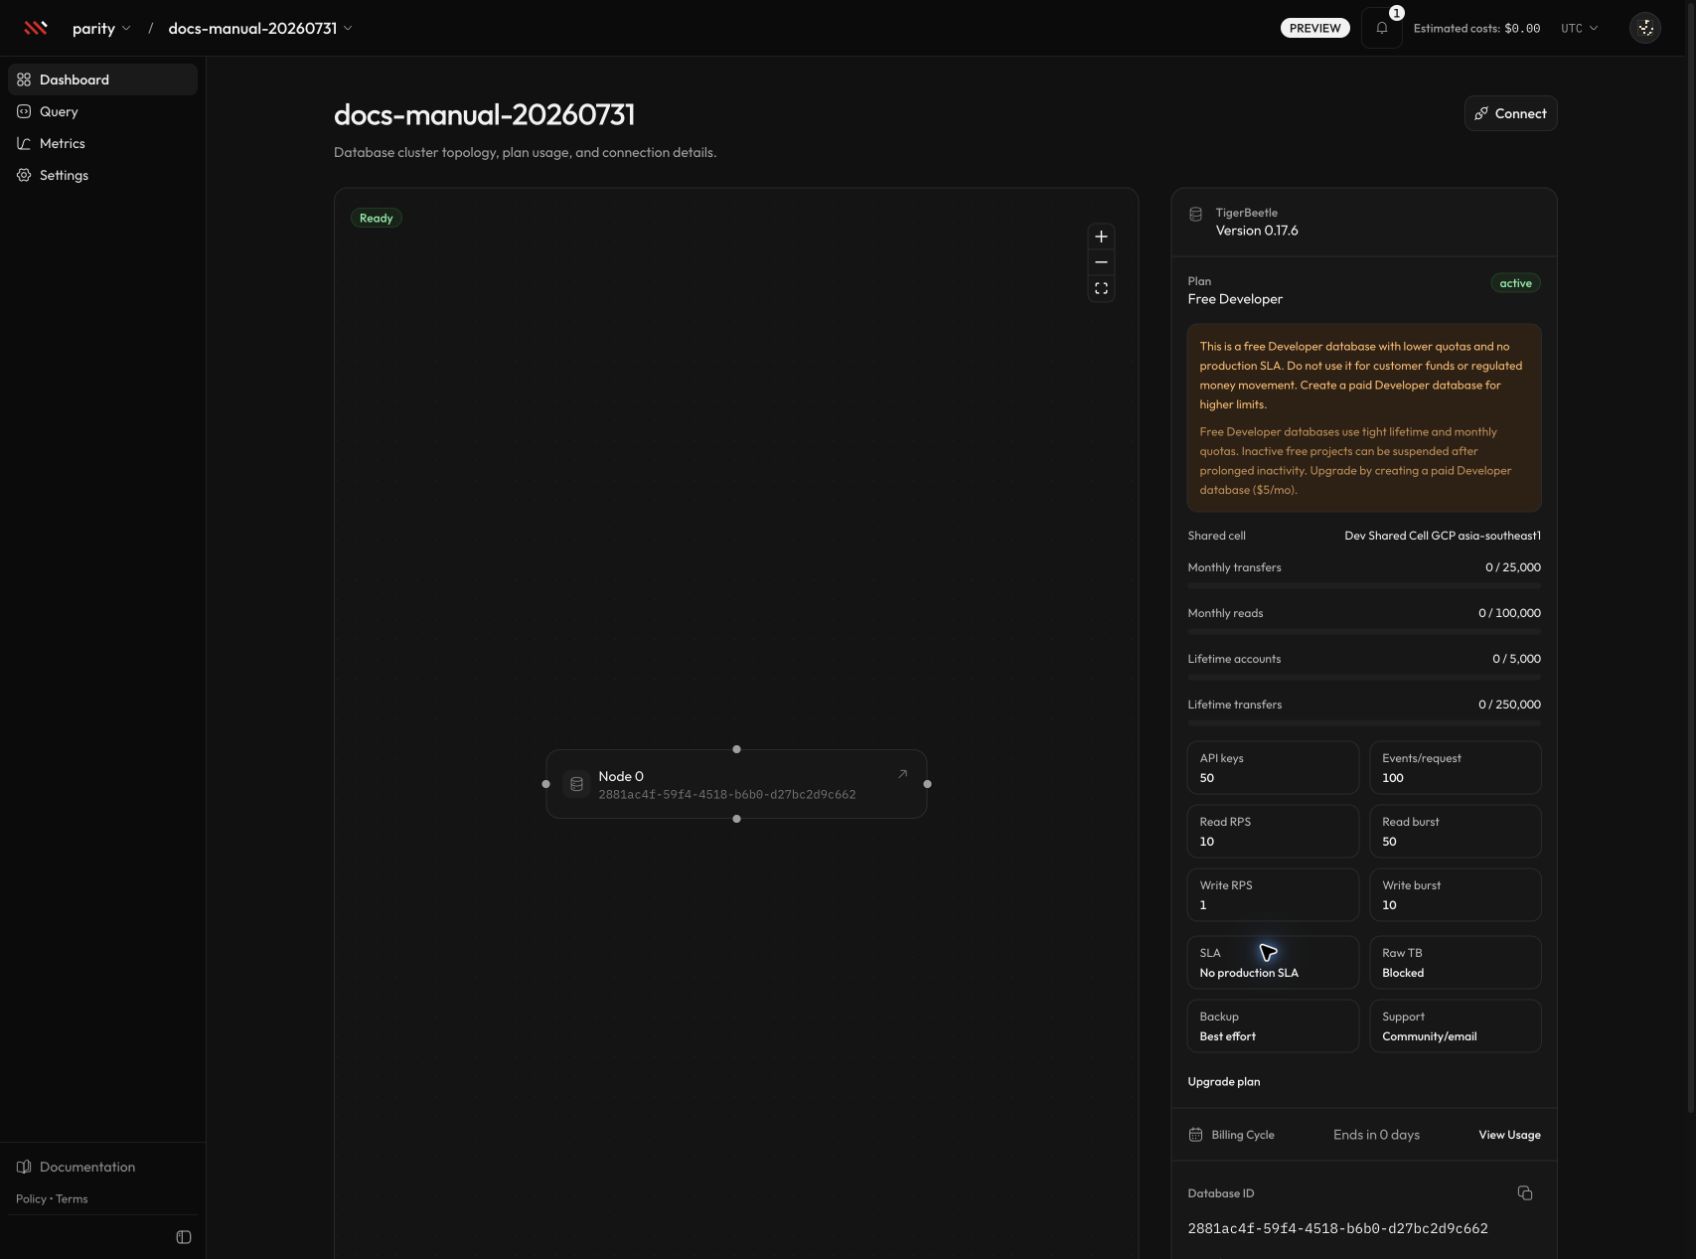
The Developer dashboard combines current quotas, rate limits, identifiers, placement, and safety guidance.
Developer details
Developer shared databases additionally show entitlement usage such as:
- monthly reads and transfers
- lifetime accounts and transfers
- pending-transfer and ledger limits
- API-key and events-per-request limits
- read and write rate/burst limits
- shared-cell placement
- metrics retention and support posture
The complimentary and paid Developer entitlements differ. Read the values from the current dashboard and Plans and limits rather than assuming all Developer databases use the same quota.
Dedicated and Production details
Isolated database dashboards can show replica nodes, machine identity, CPU, memory, storage, provider placement, and multi-region context. Their sidebar can add:
- Cluster: Instances, Storage, Parameters, CDC, and Changes
- Logs
- dedicated Metrics
- Backups
- Settings > Webhooks
Availability still depends on provider, storage tier, lifecycle state, organization role, and feature configuration.
Status and retry behavior
The dashboard presents database and profile state in product language:
| State | Meaning | Operator action |
|---|---|---|
| Not provisioned | A database record exists without a usable active profile. | Start or retry provisioning when the dashboard offers it. |
| Provisioning | Provider or placement work is active. | Wait and monitor notifications; do not send production traffic. |
| Ready | The gateway route and active profile are available. | Connect, query, and enable plan-appropriate operations. |
| Error | Provisioning or a retry failed. | Review the visible error, retry if offered, then collect support context if it repeats. |
| Deleting | Decommission or shared release is active or deferred. | Stop sending traffic and wait for completion. |
| Delete failed | Cleanup did not converge. | Review notifications and contact support before assuming resources are gone. |
Provisioning is asynchronous for isolated databases. A form or API response that says a job was queued is not proof that the database is ready.
See Database statuses for the profile and job state vocabulary.
Connect
Select Connect to open the guided three-step integration page:
- install a supported client package
- generate and configure an API key
- run a lookup to verify the route
The connection page does not reveal direct replica endpoints because all plans use the gateway path. Follow Connect to a database for the complete walkthrough.
Query
The Query explorer supports eight read and write operation families. It renders common fields, random identifier helpers for create operations, flags and advanced fields, a Run action, duration and row count, and a result grid or structured error.
Use it for controlled inspection and smoke tests. For application traffic, use the versioned API with stable identifiers, retries, and secret management.
Metrics and logs
Developer databases show shared-project quotas and request behavior. Dedicated databases can add infrastructure, gateway, and TigerBeetle views plus the logs page.
No samples can be a valid result for a new or idle database. Confirm the selected time range and plan before treating an empty chart as an outage.
Read Metrics and Logs for controls, retention, and failure diagnosis.
Cluster, backups, and settings
Dedicated configuration pages compare current and proposed state, then queue workflows. They do not mutate provider resources synchronously in the browser.
The database Settings page also contains upgrades when supported and the exact-name deletion safeguard.
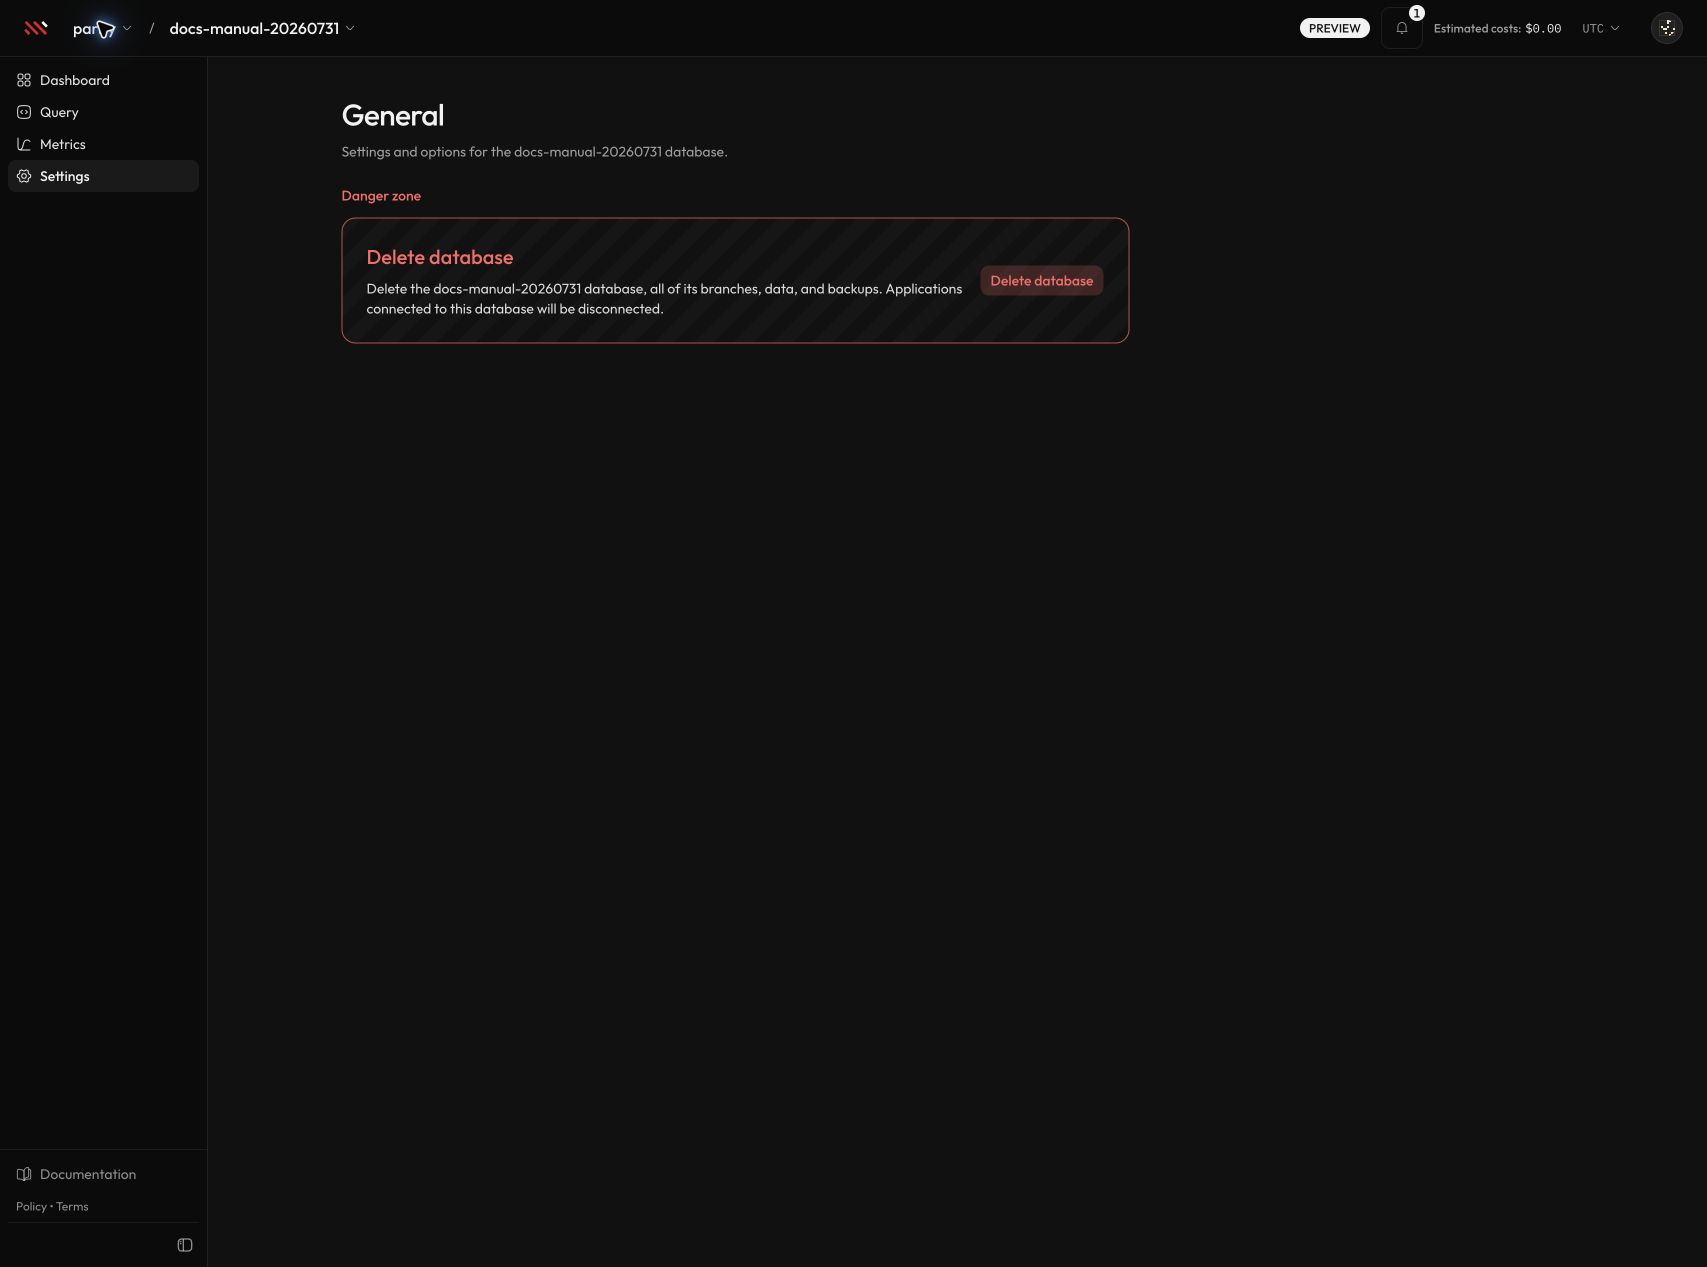
Developer Settings contains the destructive database lifecycle control; dedicated plans can add upgrade and webhook surfaces.
Before a destructive or availability-affecting action, read the corresponding manual page for provider support, downtime, rollback, retention, and expected status transitions.
Eventually consistent history
Notifications, organization audit events, cluster changes, and CDC webhook history are queue-backed read models. A workflow can complete before every related history surface refreshes.
Use the operation's primary status—database state, profile/job state, backup job, or CDC configuration—as the authoritative completion signal. Treat history pages as operational context, not the sole proof of success.
Recommended first tour
For a new organization:
- Open the database list and review the New/Import choices.
- Create a Developer database.
- Open its Dashboard and identify the plan, placement, quota, and database UUID.
- Complete Connect without generating unnecessary credentials.
- Run a read-only Query operation.
- Review Metrics and Settings.
- Open Billing usage and Notifications to understand organization-level operations.
Continue with Getting started or Database lifecycle.