Metrics
Read shared-project quotas and request telemetry or inspect dedicated cluster, API, and TigerBeetle metrics.
Use Metrics to answer two different questions, depending on the database plan:
- For a Developer shared database, how much of the project quota has been used, and what traffic is reaching this tenant?
- For a Dedicated or Production database, how are the provider machines, Parix gateway, and TigerBeetle replicas behaving?
Availability by plan
| Database plan | Metrics available |
|---|---|
| Developer (shared) | Project quotas, rate limits, accepted writes, read and write event rates, request QPS, latency, and failures or denials. Host, cluster, and TigerBeetle replica metrics are intentionally hidden because the underlying cell is shared. |
| Dedicated / Production | Provider machine metrics, API request and gateway metrics, and TigerBeetle-native replica metrics. The current provider-backed implementation supports GCP and AWS deployments. |
Developer databases do not gain infrastructure visibility by opening a different URL. Choose a dedicated-family plan when you need host, gateway, or replica-level telemetry.
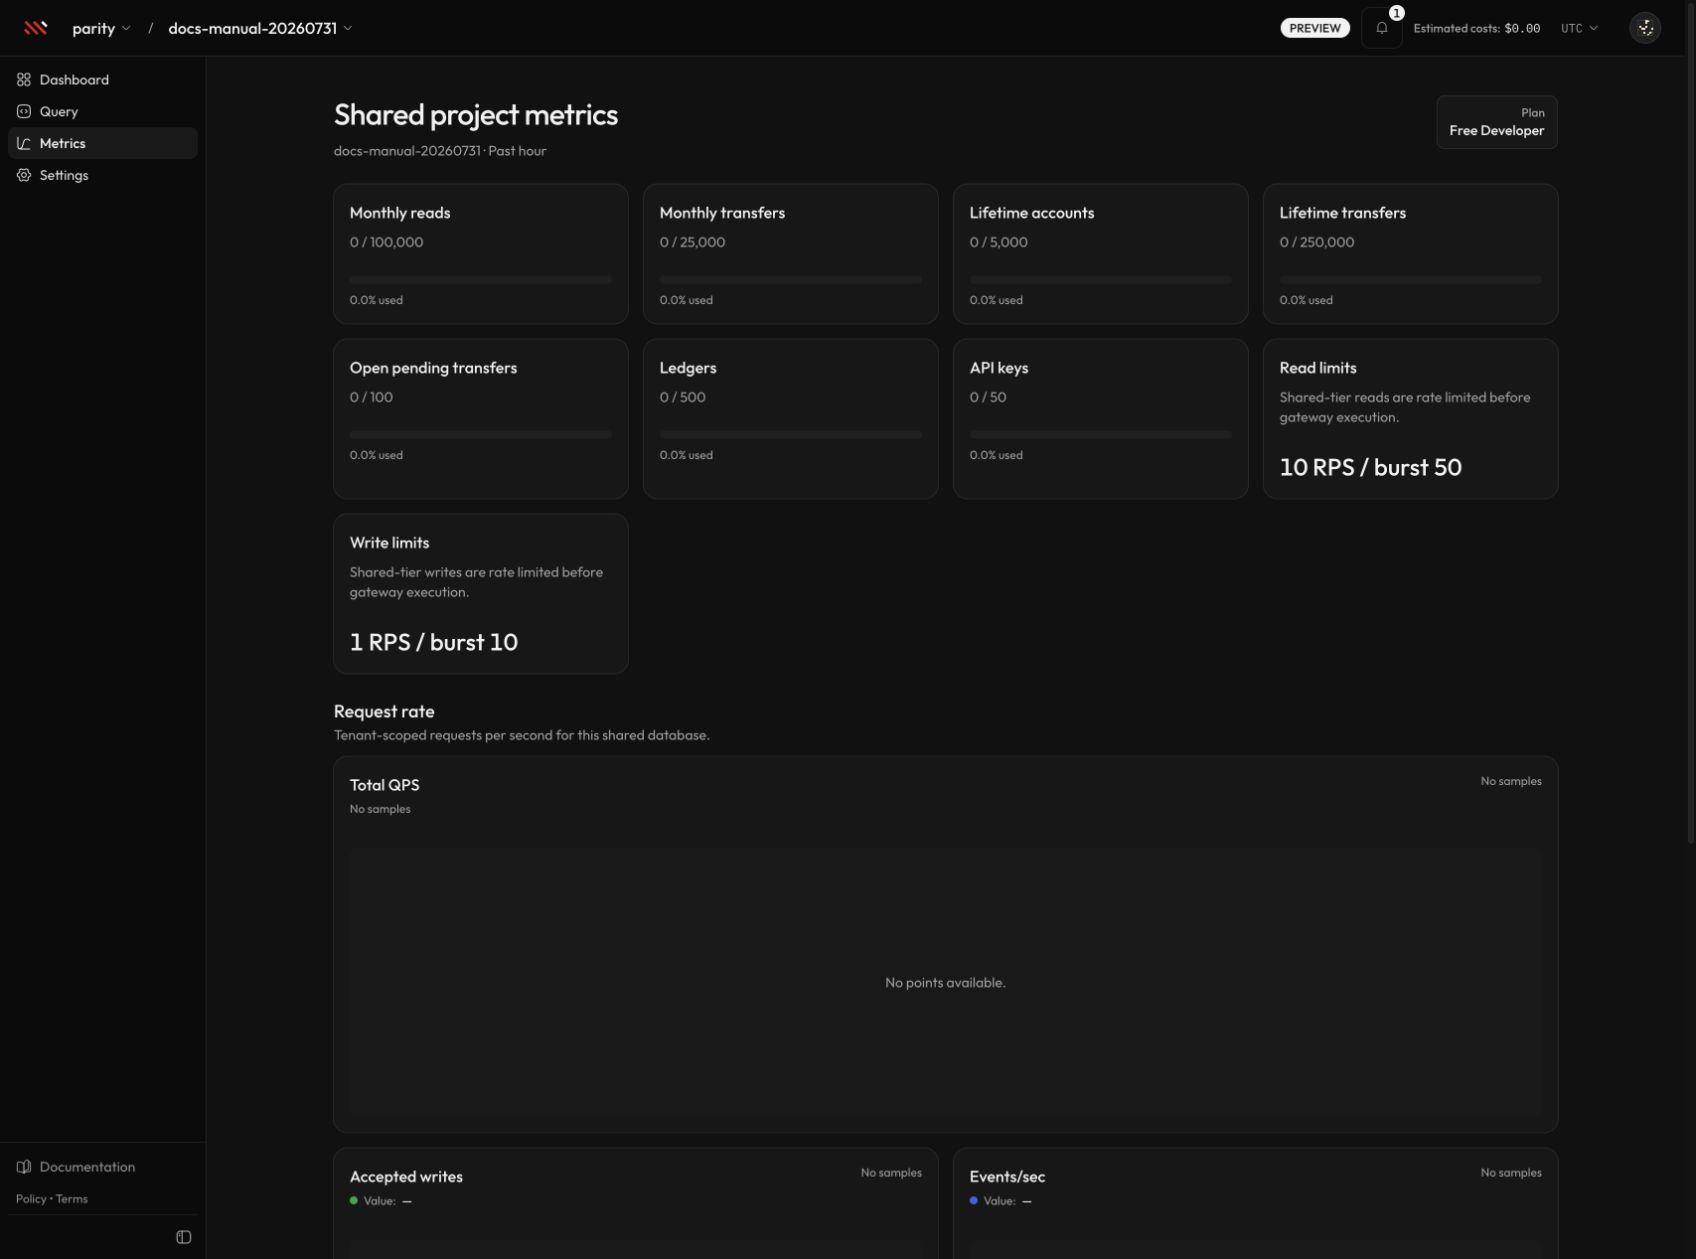
A Developer database shows tenant-scoped usage and request telemetry without exposing the shared cell. Select the image to open it at full size.
Before you begin
You need:
- a signed-in Parix account with access to the organization and database
- a database profile; a newly created database may briefly report that its profile is not available yet
- recent application traffic if you expect request charts to contain points
- a GCP or AWS-backed database for dedicated infrastructure metrics
Metrics are read-only. Viewing or refreshing this page does not require an owner or administrator role and does not queue an infrastructure workflow.
Open the Metrics page
- Select the organization.
- Open the database from Dashboard.
- Select Metrics in the database navigation.
The default range is Past hour. The page title identifies the database and the active time range.
Read shared-project metrics
Developer databases open Shared project metrics. The current page shows the past hour and the plan name.
Quota and limit cards
The first cards show current usage against the effective plan limit:
| Card | Meaning |
|---|---|
| Monthly reads | Read events counted in the current monthly usage period. |
| Monthly transfers | Transfers created in the current monthly usage period. |
| Lifetime accounts | Accounts created over the life of this shared database. |
| Lifetime transfers | Transfers created over the life of this shared database. |
| Open pending transfers | Pending transfers that have not yet resolved or timed out. |
| Ledgers | Ledgers registered for the project. |
| API keys | Enabled API keys in the organization. |
| Read limits | Sustained read requests per second and the permitted burst. |
| Write limits | Sustained write requests per second and the permitted burst. |
A quota card displays used / limit and the percentage consumed. No limit means that the active entitlement does not set a numeric cap for that item; it does not remove other gateway, request-size, or operation constraints.
Request and usage charts
Below the quota cards, inspect:
- Request rate for tenant-scoped total QPS
- Accepted writes for accepted account and transfer events
- Events/sec for the combined read and write event rate
- Read requests for read-event volume
- Latency for p50, p95, and p99 request samples
- Failures and denials, grouped by emitted failure code
- Query result size, which currently reports Unavailable because response-size samples are not emitted
The current Developer entitlement retains shared metrics for up to 72 hours. Requested ranges are clamped to the plan retention window. The dashboard currently opens the shared view at the past hour and does not expose the dedicated page's live, custom-range, or replica controls.
Expected result
Quota cards should always render once the shared profile exists. Traffic charts may legitimately show No samples or No points available when the database has not received matching operations in the selected interval. That is an empty result, not evidence that the database is unavailable.
Inspect dedicated metrics
Dedicated and Production databases open the full Metrics dashboard.
Time and refresh controls
Use the controls in the page header:
- Past 15 minutes, Past hour, Past 3 hours, Past 6 hours, Past 12 hours, or Past day selects a preset window.
- Custom range opens separate From and To date and time fields. The start must be before the end.
- Live is enabled by default. It refreshes the selected range every 30 seconds and also refreshes when the page returns to the foreground or receives a new observability event.
- Refresh metrics requests the selected range immediately.
Applying a custom range turns Live off so the historical interval remains fixed. Turn Live back on only when you want that same range request refreshed.
Cluster tab
Use Cluster for machine and capacity signals:
- cluster node identity, location, and latest machine state
- per-replica selection when the profile has more than one machine scope
- CPU and memory utilization
- raw memory used versus total memory
- raw disk used versus total disk
- disk utilization percentage
- machine restart count
- network ingress and egress
The selected replica drives the system charts and the replica-scoped TigerBeetle charts. If more than one replica card is shown, select a card before comparing an individual node with the cluster summary.
API tab
Use API to inspect gateway traffic:
- total API-key-authenticated TigerBeetle QPS
- QPS broken down by supported operation
- gateway p95 latency
- gateway error rate
- the timestamp of the most recent request sample
No API samples can mean that the application used a different database, the selected range is too narrow, or no API-key-authenticated operations reached the gateway during that interval.
TigerBeetle tab
Use TigerBeetle for replica-native signals:
- cluster-level Replica health
- State sync stage
- Cache hit rate and cache hits versus misses
- worst latest replica request p95
- replica status and sync-stage trends
- request p95 and request count by TigerBeetle operation
An empty TigerBeetle section can coexist with valid host metrics while the provider's local telemetry bridge is not yet publishing samples.
Expected result
After the initial load, the selected tabs should show charts for the requested window and, for multi-replica profiles, machine-scoped cards. A notice can describe partial telemetry without blocking the metrics that are available.
Provider and plan limitations
- Dedicated infrastructure metrics currently require an active GCP or AWS database profile. Other providers display Metrics are not available for this deployment provider yet.
- Provider and region availability is controlled by the live create catalog. AWS-backed paths are implemented, but AWS may not be offered for new production databases in the current catalog.
- GCP memory utilization depends on guest telemetry from Ops Agent.
- GCP TigerBeetle-native metrics depend on the local Telegraf DogStatsD bridge into Cloud Monitoring.
- AWS runtime metrics depend on CloudWatch Agent. Older AWS replicas may remain partial until reprovisioning or an upgrade installs the required agent configuration.
- AWS TigerBeetle-native metrics depend on local StatsD collection through CloudWatch Agent.
- Shared databases expose only their own project metrics. Parix does not reveal shared-cell CPU, memory, disk, logs, machine identity, or TigerBeetle replica internals.
Queued workflows and status behavior
Metrics has no mutation control and queues no workflow. Live and Refresh metrics only run read requests. During provisioning, restore, or another lifecycle change, the page may show a missing-profile or partial-data notice until the active profile and collectors converge.
Troubleshooting
The page says the profile is not available
Return to Dashboard and wait until the database is Ready. If provisioning has failed, resolve that lifecycle error before diagnosing metrics.
Shared quota cards load but request charts are empty
- Run a small operation from Query or from an API-key-authenticated client.
- Return to Metrics after the request sample has been emitted.
- Confirm that the operation targeted this database and that the selected usage period contains it.
Usage counters and request samples come from different sources, so they can converge at different times.
Dedicated charts show no points
- Widen the time range.
- Select Refresh metrics.
- Check the provider notice above the charts.
- Compare host charts with the API and TigerBeetle tabs to determine which telemetry path is missing.
- If only one replica is empty, select each replica card and compare its latest machine state.
Only some AWS charts are populated
This usually indicates partial CloudWatch Agent coverage on an older deployment. Reprovisioning or a supported upgrade may be required before all runtime and TigerBeetle StatsD series appear. If every replica is empty, also verify the regional gateway and provider telemetry path.
The custom range is rejected
Choose valid dates and times and make From earlier than To. Very old data may have expired even when the range itself is valid.
For a combined diagnostic checklist, see Observability, backups, and CDC.
Next steps
- Open Logs to correlate a dedicated metric spike with operational events.
- Review Cluster configurations before changing a dedicated topology or size.
- Review Plans and limits when a shared quota is close to its limit.